
Drug Pricing Indexes: Average Sales Price (ASP)
Most conversations about drug pricing tend to center on the pharmacy benefit—home to familiar benchmarks like AWP and NADAC. For those operating in that space, the medical benefit can feel like a separate system with its own rules, incentives, and risks. In many respects, it is. Average Sales Price (ASP) sits at the center of that system. It is the primary pricing index used to determine how Medicare reimburses providers for drugs administered in clinical settings. As specialty spend continues to grow—and increasingly shift across benefit lines—understanding ASP is no longer optional. It is foundational. In this installment of The Coy Pharmer’s Drug Pricing Index Series, we will break down what ASP is, how it works in practice, and where it can create disconnects between reimbursement and real-world economics.
6/1/20265 min read

In this Episode:
The Basics
When it is Used
In Practice
How it Works
Reporting Timing
Parallel Concepts
The Fine Print
Pros and Cons
Market Changes
Site of Care Mix
Shared HCPCS
The Basics of Average Sales Price
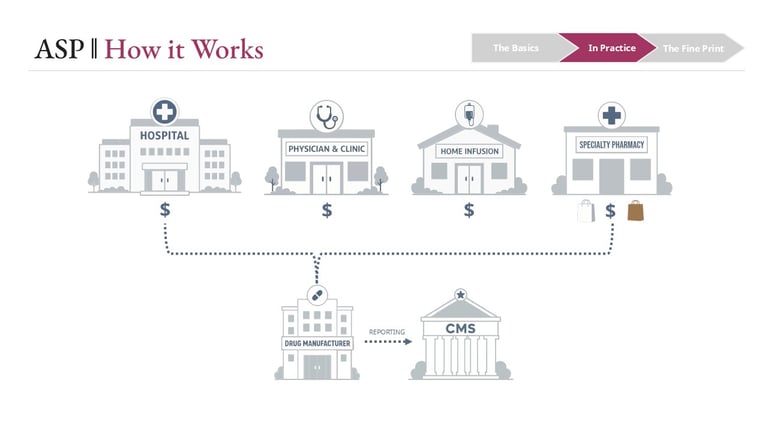
Average Sales Price is designed to reflect the average price realized by manufacturers for drugs sold to a defined set of purchasers. Those purchasers include hospitals, physician offices, outpatient clinics, home infusion providers, and certain specialty pharmacies operating under white- and brown-bagging arrangements.
At its core, ASP is a net price construct. Manufacturers report sales data to CMS on a quarterly basis, and that data includes not just invoice prices, but also most price concessions—such as volume discounts, prompt pay discounts, and rebates (subject to statutory definitions and exclusions). CMS then aggregates that information into a weighted average at the HCPCS code level.
In Practice
The Fine Print
Conclusion
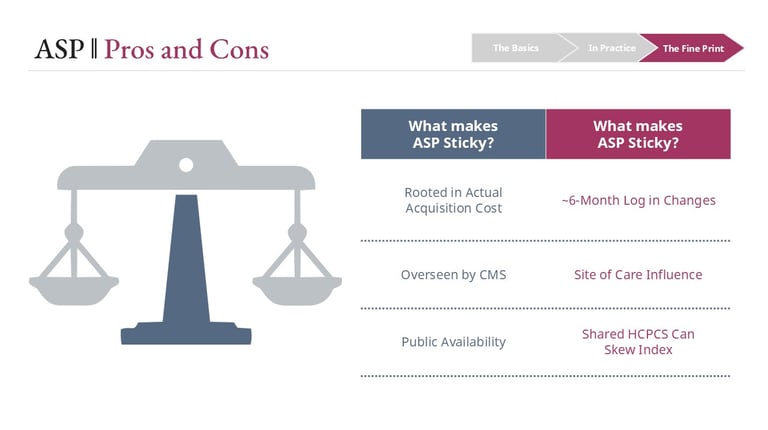
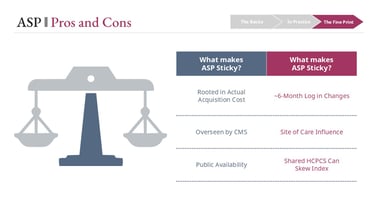
Average Sales Price is the foundational reimbursement mechanism for drugs covered under the medical benefit. It is designed to reflect real-world pricing, but it does so through a structure that introduces both delay and averaging effects.
Three dynamics consistently shape how ASP behaves in the market:
• A built-in reporting lag that delays price signal transmission
• Sensitivity to site-of-care mix, particularly 340B utilization
• The aggregation effects of shared HCPCS codes
For providers, health systems, and benefit stakeholders, these are not edge cases—they are core drivers of financial performance.
Understanding ASP is not just about understanding a formula. It is about recognizing how utilization, contracting, and market shifts flow through that formula—and where misalignment between cost and reimbursement can emerge.
As specialty drug management continues to evolve, that understanding becomes increasingly critical.
What ASP is intended to capture
Positioning ASP alongside other benchmarks
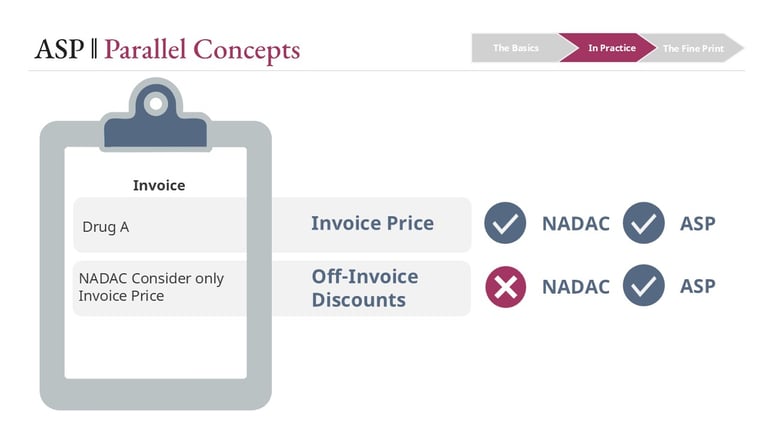
ASP is often compared to NADAC on the pharmacy benefit side. Both aim to approximate acquisition cost rather than rely on list prices. But the mechanics differ in important ways:
• NADAC reflects pharmacy invoice pricing and does not capture most off-invoice concessions
• ASP is designed to incorporate a broader set of discounts, making it a closer approximation of net manufacturer revenue
The result is an index that is more comprehensive—but still an average. It does not represent any single provider’s acquisition cost.
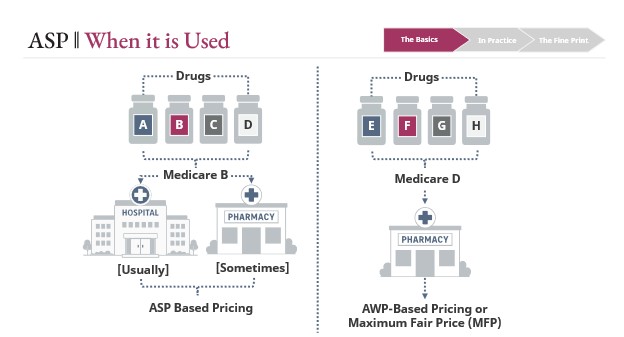
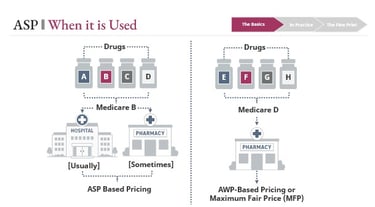
Where ASP shows up
ASP is primarily used under Medicare Part B, which covers drugs administered in clinical settings. This includes:
• Infused and injected therapies in hospitals and outpatient clinics
• Physician-administered drugs (e.g., oncology, rheumatology)
• Home infusion therapies
• A limited set of pharmacy-dispensed products tied to durable medical equipment or clinical administration
This stands in contrast to Medicare Part D, which generally covers retail and specialty pharmacy drugs and relies more heavily on AWP-based constructs and negotiated pricing.
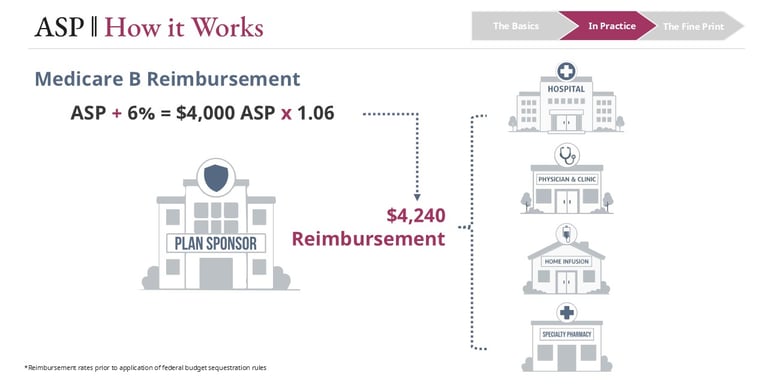
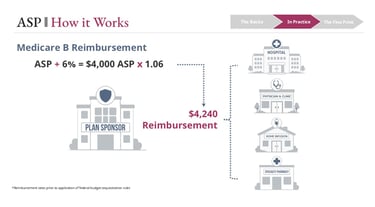
How reimbursement is determined
For most Part B drugs, Medicare reimbursement is set at:
• ASP + 6%
In simple terms, a drug with an ASP of $4,000 would be reimbursed at $4,240.
Two important nuances:
• Due to federal sequestration, the effective add-on is typically closer to ASP + ~4.3%, not the full 6%
• The reimbursement rate is uniform across providers for a given HCPCS code, regardless of site of care or acquisition cost
That uniformity simplifies payment—but it also sets up many of the economic tensions that follow.
The Reporting Lag
ASP is inherently backward-looking. Manufacturers report sales data quarterly, CMS validates and processes that data, and updated rates are published the following quarter. The result is roughly a two-quarter (about six-month) lag between when transactions occur and when they affect reimbursement.
Why this matters
When acquisition costs change—particularly when they increase—providers may find themselves purchasing drugs at higher prices while still being reimbursed based on older, lower ASP data.
A common scenario:
• A manufacturer increases WAC mid-year
A provider purchasing at WAC minus a fixed percentage sees costs rise immediately
• ASP-based reimbursement does not adjust for up to six months
Site of Care Mix
ASP is a volume-weighted average across multiple provider types, each with different purchasing economics:
• Non-340B hospitals
• 340B covered entities
• Physician offices
• Home infusion providers
• Specialty pharmacies
Because these entities acquire drugs at different effective prices—especially 340B providers, which purchase at significantly reduced rates—the mix of where drugs are dispensed directly impacts ASP.
What this creates
If utilization shifts toward lower-cost settings, ASP declines—even if nothing changes for other providers.
For example:
• ASP supports reimbursement of $5,031
• Utilization shifts toward 340B entities
• ASP recalculates lower → reimbursement drops to $4,948
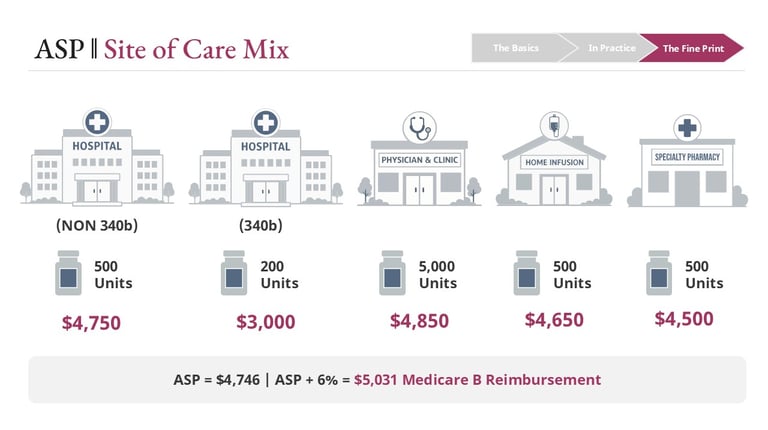
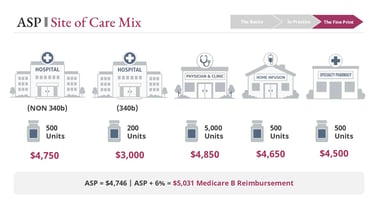
That new, lower rate applies to all providers billing that HCPCS code, including those whose acquisition costs did not change.
This is one of the clearest examples of how ASP reflects the market as a whole, not the economics of any individual participant.
During that window, margin compression—or even negative margin—is not just possible, but common.
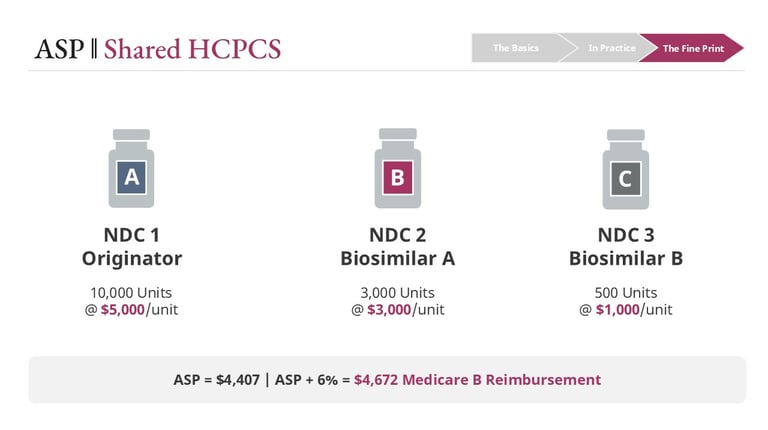
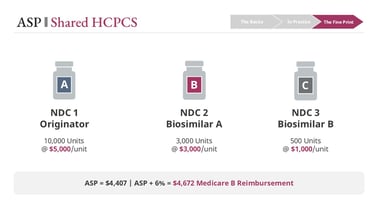
Shared HCPCS Codes
On the medical benefit, drugs are billed using HCPCS codes rather than NDCs. Unlike NDCs, which are product-specific, HCPCS codes can group multiple products under a single billing identifier.
These groupings may include:
• Different strengths of the same drug
• Originator biologics and biosimilars (particularly in earlier market phases)
• Different formulations of a product
At the same time, similar products are not always grouped consistently. Coding decisions can vary in ways that are not always intuitive.
Why this matters for ASP
ASP is calculated at the HCPCS code level, meaning all products within a code share the same reimbursement rate.
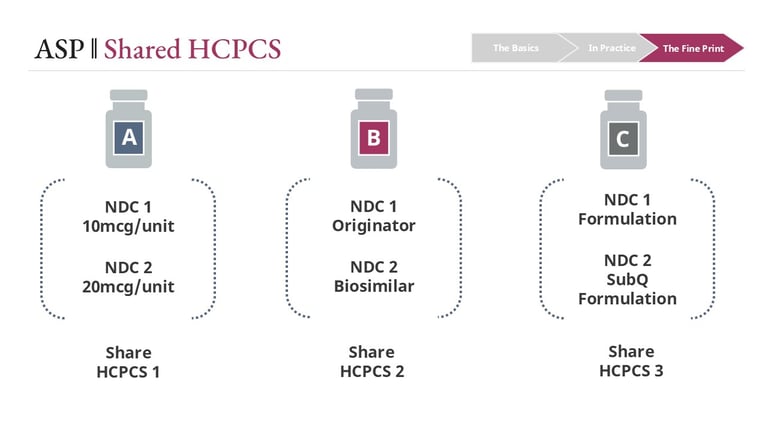
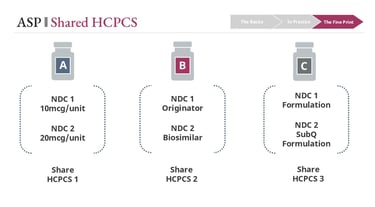
This creates a critical dynamic:
• Lower-cost products pull the ASP down
• Higher-cost products may become less profitable—or unprofitable
Utilization shifts amplify the effect
If prescribing shifts from an originator to a lower-cost biosimilar:
• ASP declines
• Reimbursement declines for all products in that code
Depending on acquisition cost:
• Biosimilar users may maintain or improve margin
• Originator users may see margin compression or loss
In some contracting scenarios, the reverse can occur—creating counterintuitive incentives where the lower-cost product is not the most financially viable option.
Links
hello@thecoypharmer.com
© 2025 The Coy Pharmer, LLC. All Rights Reserved.