
Drug Pricing Indexes: Comparing AWP and NADAC
Welcome to The Coy Pharmer, where we cultivate clarity in the complex world of pharmacy benefits. In this post, we explore two of the most commonly referenced drug pricing benchmarks: Average Wholesale Price and National Average Drug Acquisition Cost. These indexes play distinct roles in how drugs are priced, reimbursed, and evaluated across the pharmacy ecosystem. Whether you are new to pharmacy benefits or looking to deepen your understanding, this overview will help frame how each benchmark functions and why the differences matter.
3/6/20266 min read

In this Episode:
The Basics
The Acronyms
Key Comparisons
In Practice
Basis Parity
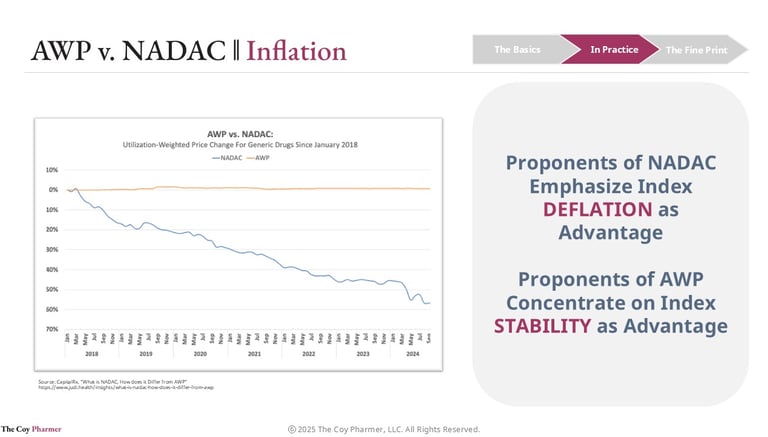
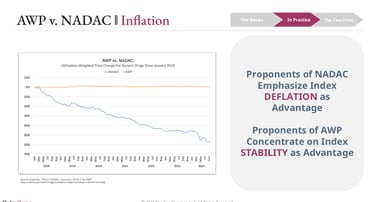
Inflation
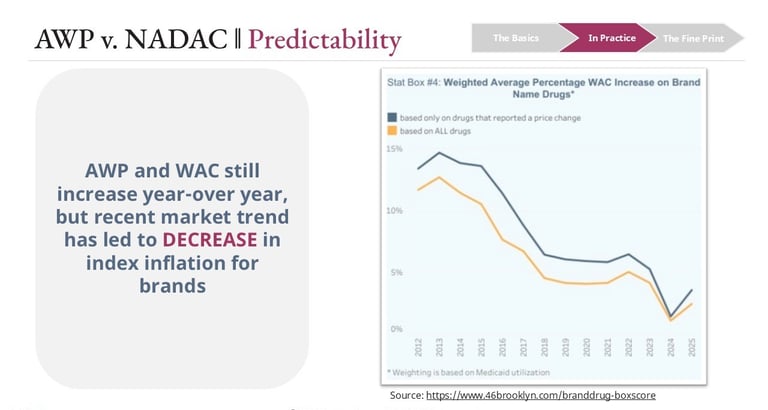
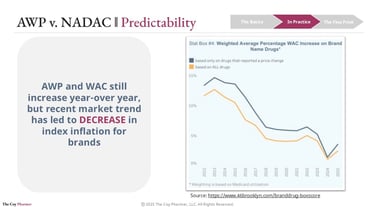
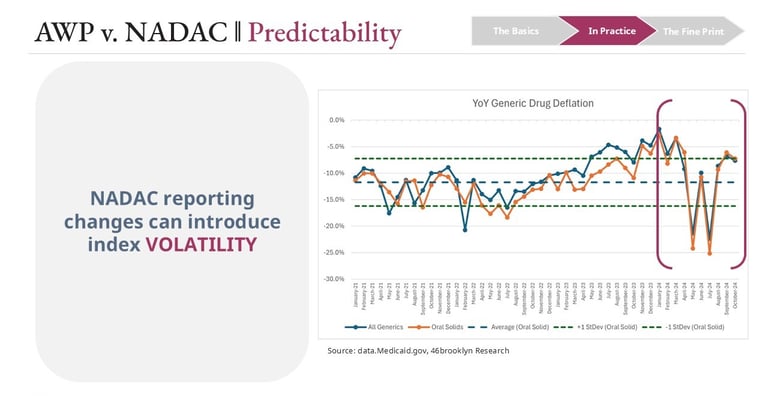
Predictability
The Fine Print
Plan Decisions
Consultant Questions
The Basics of AWP and NADAC
Average Wholesale Price is one of the most widely used reference points in the pharmacy industry. It functions as a manufacturer-reported list price that is published in commercial pricing compendia such as First Databank and Medi-Span. Despite its name, this benchmark does not reflect actual prices paid by pharmacies, payers, or members, but instead serves as a standardized starting point for pricing and reimbursement calculations. A key advantage of this index for contracting is the comprehensive nature of the index, offering a list price for all marketed prescription drugs.
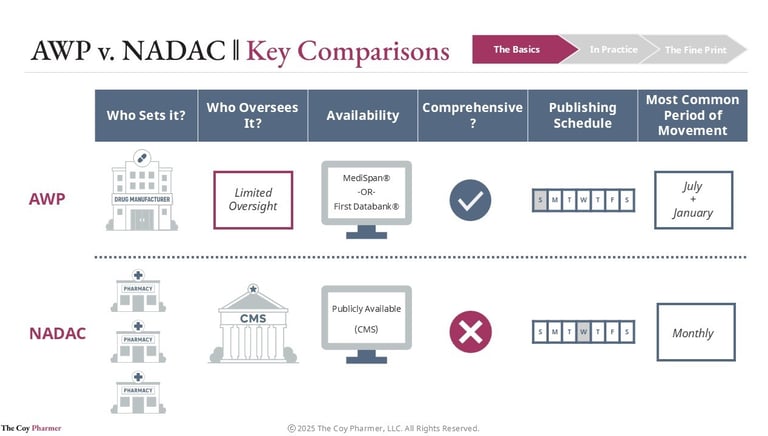
National Average Drug Acquisition Cost is designed to reflect what select pharmacies actually pay to acquire medications. This benchmark is calculated using acquisition cost data voluntarily reported by pharmacies and is published under the oversight of the Centers for Medicare & Medicaid Services. Because the index is tied to reported purchase prices rather than manufacturer list prices, it often tracks closer to market dynamics and may trend lower than list-based benchmarks. The result is a pricing reference that emphasizes transparency and real-world purchasing behavior. Given the real-world nature of the NADAC index, gaps exist where some drugs do not have a NADAC price listed. This can create practical challenges when using NADAC as a basis for reimbursement or billing.
Practical Applications in Contracting
Both pricing benchmarks are commonly used in contracts between pharmacy benefit managers, plan sponsors, and pharmacies. Many Commercial and Medicare agreements rely on Average Wholesale Price as the foundation for reimbursement, with discounts applied to arrive at payment terms. Examples include reimbursement structures such as a fixed percentage below the published list price for generic and brand medications, which establish predictable pricing formulas across the supply chain.
National Average Drug Acquisition Cost is often used in contracts that emphasize pass-through or cost-based reimbursement, and is most commonly deployed to advise reimbursement to pharmacies within state Medicaid programs. Under these arrangements, pharmacies may be reimbursed at or near the same benchmark used to calculate plan sponsor costs, which can reduce pricing opacity. These structures are frequently positioned as easier to model and audit, particularly for generic drugs, although they may introduce greater variability as acquisition costs fluctuate.
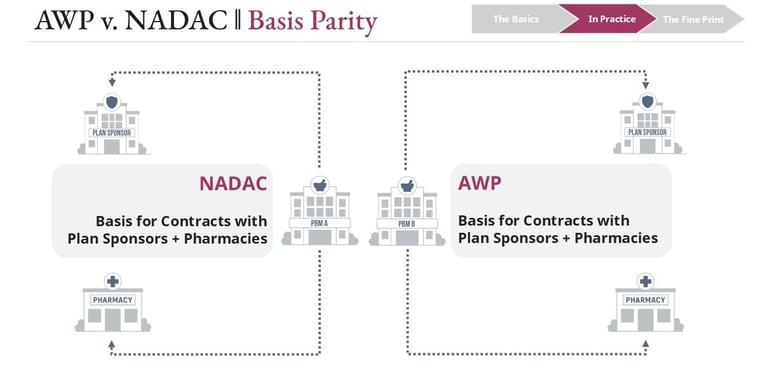
Some pharmacy benefit managers maintain pharmacy networks and payer contracts that rely on different pricing benchmarks. In certain cases, contracts with plan sponsors may be structured around AWP, while pharmacy reimbursement may be based on NADAC. When this misalignment exists, unexpected movement in either pricing index can introduce financial risk.
Comparing and Contrasting
AWP and NADAC
Conclusion
Average Wholesale Price and National Average Drug Acquisition Cost each serve distinct and important functions within the pharmacy benefits landscape. One pricing framework offers broad product coverage and long-standing consistency, while the other emphasizes transparency and closer alignment with pharmacy acquisition costs. Evaluating these benchmarks requires understanding not only how they are constructed, but also how they behave over time and across different drug categories.
Contracts that rely on AWP may benefit from more frequent market evaluations or shorter contract terms, given the tendency of list-based pricing to increase over time. Agreements structured around NADAC can benefit from clearly defined provisions addressing specialty medications or newly launched products, as these drugs may not initially have published NADAC pricing. When comparing a contract based on AWP to one based on NADAC, the most reliable analyses focus on realistic assumptions about inflation and deflation patterns for each benchmark rather than on headline discounts or dispensing fees alone.
At The Coy Pharmer, the focus is on helping stakeholders understand these distinctions so they can approach drug pricing decisions with greater confidence. Ongoing exploration of pricing benchmarks and contracting strategies remains essential as market conditions and policy dynamics evolve. The goal continues to be bringing clarity to a complex system and supporting better-informed decisions across the healthcare ecosystem.
To manage this exposure, many pharmacy benefit managers design network contracts that align the pricing methodology used on both sides of the transaction. Matching the benchmark used for payer pricing with the benchmark used for pharmacy reimbursement helps reduce variability and improves predictability. This alignment allows financial performance to be driven more by utilization and contract terms rather than by unanticipated shifts in pricing indexes.
In cases where commercial payers may face choices between AWP and NADAC-based contracts, several different points of view come to light. Proponents of NADAC often point to historical deflation in generics drug pricing within the index as a primary advantage. Supporters of an AWP-based contracting strategy emphasize stability and predictability as a key forecasting advantage.
Over the past decade, approaches to price increases tied to Average Wholesale Price and its related benchmark, Wholesale Acquisition Cost, have shifted meaningfully. Increased political scrutiny and the emergence of legislative proposals contributed to a moderation in list price inflation compared with prior periods. As a result, annual increases tied to these benchmarks have generally trended lower than the levels seen in earlier years.
For plan sponsors that entered into contracts assuming that list prices would continue to rise at rates approaching ten percent annually, actual costs may have come in below forecast. Lower-than-anticipated inflation reduced the impact of list-based pricing increases on overall plan spend in some cases. This divergence highlights the importance of aligning long-term assumptions with evolving market and policy conditions.
Recent policy developments may reinforce this lower inflation environment. Provisions introduced under the Inflation Reduction Act are intended to influence pricing behavior, particularly within government programs, and may indirectly affect broader list price strategies over time. The mechanics and downstream impacts of this legislation are complex and will be explored in a dedicated post.
During 2024, some observers noted that shifts in the composition of pharmacies reporting acquisition data to federal authorities appeared to influence NADAC pricing. Changes in the reporting mix can affect the calculated index, particularly when participation patterns move toward or away from certain pharmacy types or purchasing profiles. In these situations, either plan sponsors or pharmacies may find themselves in a more favorable or less favorable financial position than originally projected, depending on the direction of the shift.
Because accurate budgeting is critical for all parties, unexpected movement in index behavior can create downstream effects that were not anticipated during contracting. For plan sponsors, this may translate into sudden changes in projected drug spend. For pharmacies, rapid shifts may result in reimbursement levels that temporarily fall below acquisition costs, increasing the risk of dispensing certain medications at a loss.
The Fine Print
Understanding the nuances of each benchmark is essential when reviewing or negotiating contracts. Inflation assumptions, update frequency, and coverage gaps can materially affect cost projections over time. Accurate modeling requires aligning contract terms with realistic expectations about how each index behaves.
Consultants and plan sponsors should ensure that financial analyses account for both the stability of list-based pricing and the variability of acquisition-based benchmarks. Failing to consider these dynamics can lead to misleading comparisons or unexpected cost exposure. A disciplined approach to evaluating the fine print is critical for informed decision-making.
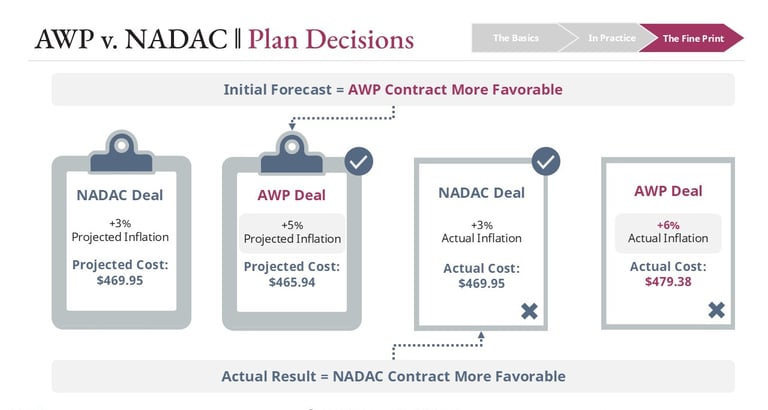
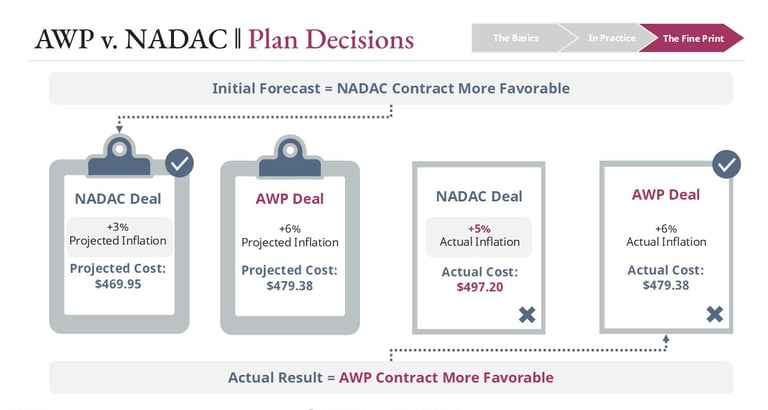
These examples illustrate situations in which a plan sponsor selects a contract using inflation assumptions that ultimately diverge from actual market behavior. The scenario is intentionally simplified to focus on how pricing benchmarks can perform differently over time. Even in a basic model, small differences in inflation assumptions can materially affect outcomes across a multi-year contract.
In this example, a single brand drug is evaluated under two pricing frameworks using current market benchmarks. The National Average Drug Acquisition Cost is assumed to be $420, paired with a contracted dispensing fee of $11, while the Average Wholesale Price is assumed to be $500 with a contracted brand discount of 19.5% off of AWP. These assumptions result in comparable ingredient cost levels at the outset of the contract period.
As the contract progresses into its third year, inflation compounds and begins to influence the relative performance of each pricing approach. Depending on how list prices and acquisition costs evolve, the initially equivalent options may no longer produce the same net results. Aligning modeling assumptions with realistic expectations of market behavior is therefore essential when evaluating contracts based on National Average Drug Acquisition Cost versus those based on Average Wholesale Price.
Links
hello@thecoypharmer.com
© 2025 The Coy Pharmer, LLC. All Rights Reserved.